Economy of Chile
| Economy of Chile | |
|---|---|
| Rank | 46 |
| Currency | Chilean peso (CLP) |
| Fiscal year | calendar year |
| Trade organisations | WTO, APEC, SACN, Mercosur (associate), CAN (associate), Unasur |
| Statistics | |
| GDP | $164.615 billion (2009)[1] |
| GDP growth | -1.5% (2009), 1.0% (Q1 2010),[1] 6.5% (Q2 2010)[2] |
| GDP per capita | $9,672 (2009)[1] |
| GDP by sector | agriculture & mining: 22.5%, industry: 25.2%, services: 52.3% (2008)[3] |
| Inflation (CPI) | 1.5% (2009, 12-month average), -1.4% (2009, dec./dec.)[4] |
| Population below poverty line |
15.1% (2009)[5] |
| Gini index | 54 (2006)[6] |
| Labour force | 7.30 million (2009)[7] |
| Labour force by occupation |
agriculture & mining: 12.6%, industry: 21.8%, services: 65.6% (2009)[8] |
| Unemployment | 9.7% (2009)[7] |
| Main industries | copper, other minerals, foodstuffs, fish processing, iron and steel, wood and wood products, transport equipment, cement, textiles |
| Ease of Doing Business Rank | 49th[9] |
| External | |
| Exports | $53.736 billion fob (2009, goods)[1] |
| Export goods | copper, fruit, fish products, paper and pulp, chemicals, wine |
| Main export partners | China 14.1%, U.S. 11.3%, Japan 10.4%, Brazil 5.9%, South Korea 5.7%, Netherlands 5.2%, Italy 4.4% (2008) |
| Imports | $39.754 billion fob (2009, goods)[1] |
| Import goods | petroleum and petroleum products, chemicals, electrical and telecommunications equipment, industrial machinery, vehicles, natural gas |
| Main import partners | U.S. 19.1%, China 11.9%, Brazil 9.2%, Argentina 8.8%, South Korea 5.5%, Japan 4.6% (2008) |
| FDI stock | $115 billion (31 December 2009 est.) |
| Gross external debt | $74.041 billion (2009)[1] |
| Public finances | |
| Public debt | 6.1% of GDP (2009, central government)[1] |
| Revenues | $31.31 billion (2009 est.) |
| Expenses | $37.87 billion (2009 est.) |
| Economic aid | $0 million (2006) |
| Foreign reserves | $25.373 billion (2009)[1] |
| Main data source: CIA World Fact Book All values, unless otherwise stated, are in US dollars |
|
Chile has a dynamic market-oriented economy characterized by a high level of foreign trade. During the early 1990s, Chile's reputation as a role model for economic reform was strengthened when the democratic government of Patricio Aylwin - which took over from the military in 1990 - deepened the economic reform initiated by the military government. Growth in real GDP averaged 8% during the period 1991-1997, but fell to half that level in 1998 because of tight monetary policies implemented to keep the current account deficit in check and because of lower export earnings - the latter a product of the Asian financial crisis. Chile's economy has since recovered and has seen growth rates of 5-7% over the past several years.
The Global Competitiveness Report for 2009-2010 ranks Chile as being the 30th most competitive country in the world and the first in Latin America, well above from Brazil (56th), Mexico (60th) and Argentina which ranks 85th.[10] The Ease of doing business index created by the World Bank lists Chile as 49th in the world that encompasses better, usually simpler, regulations for businesses and stronger protections of property rights.[11] The OECD agreed to invite Chile to be among four countries to open discussions in becoming an official member.[12] In spite of this, Chile still suffers from many problems common in Latin America, ranking higher than such countries as Mexico in terms of economic inequality and unemployment rate.[13][14][15]
Contents |
Macroeconomic trend
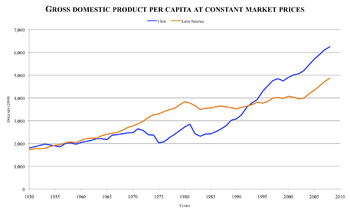
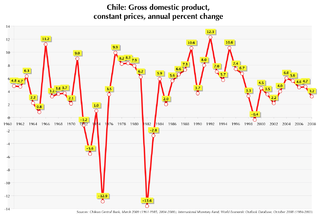
After a decade of highly impressive growth rates, Chile experienced a moderate recession in 1999 brought on by the global economic slowdown and exacerbated by a severe drought reducing crop yields and causing hydroelectric shortfalls and rationing. Chile experienced negative economic growth for the first time in more than 15 years.[16] Despite the effects of the recession, Chile maintained its reputation for strong financial institutions and sound policy that have given it the strongest sovereign bond rating in South America. After averaging real GDP growth rates of around 7% in the 1990s, the economy grew 3.4% in 1998 and contracted 1.1% in 1999. By the end of 1999, exports and economic activity had begun to recover. The economy has recovered in 2000, with Asian markets rebounding and copper prices edging up. GDP growth for 2001 is expected in the 5%-6% range. The inauguration of Ricardo Lagos in March 2000, succeeding Eduardo Frei, kept the presidency in the hands of the center-left Concertacion coalition that had held office since the return of civilian rule in 1990.
The government's limited role in the economy, Chile's openness to international trade and investment, and the high domestic savings and investment rates that propelled Chile's economy to average growth rates of 8% during the decade before the recession are still in place. The 1973-90 military government sold many state-owned companies, and the three democratic governments since 1990 have continued privatization at a slower pace.
Unemployment peaked well above Chile's traditional 4%-6% range during the recession and is stubbornly remaining in the 8%-10% range well into the economic recovery. Despite recent labour troubles, wages have on average risen faster than inflation over the last several years as a result of higher productivity, boosting national living standards. The share of Chileans with incomes below the poverty line — roughly $90/month for a family of four — fell from 46% of the population in 1987 to 14% in 2006. Critics, however, argue that this poverty line is unrealistically low, and point to previous studies by the National Census Institute which consider as much as 29% of population to be affected by poverty.
Maintaining a moderate inflation level is a foremost Central Bank objective. In 1996, December-to-December inflation stood at 8.2%, falling to 6.1% in 1997 and to 4.7% in 1998. The rate fell to only 2.3% during the 1999 recession. Most wage settlements and spending decisions are indexed, reducing inflation volatility (See Unidad de Fomento). The rate for 2000 was 4.75%. The establishment of a compulsory private sector pension system in 1981 was an important step toward increasing domestic savings and the pool of investment capital.[17] Under this system, most regular workers pay 10% of their salaries into privately managed funds. This large capital pool has been supplemented by substantial foreign investment.
Total public and private investment in the Chilean economy has remained high despite current economic difficulties. The government recognizes the necessity of private investment to boost worker productivity. The government also is encouraging diversification, including such non-traditional exports as fruit, wine, and fish to reduce the relative importance of basic traditional exports such as copper, timber, and other natural resources.
Chile's welcoming attitude toward foreign direct investment is codified in the country's Foreign Investment Law, which gives foreign investors the same treatment as Chileans. Registration is simple and transparent, and foreign investors are guaranteed access to the official foreign exchange market to repatriate their profits and capital. The Central Bank decided in May 1999 on the removal of the 1-year residency requirement on foreign capital entering Chile under Central Bank regulations, generally for portfolio investments. A modest capital control mechanism known as the "Encaje," which requires international investors to place a percentage of portfolio investment in non-interest-bearing accounts for up to 2 years, has been effectively suspended through reduction to zero of the applicable percentage; the mechanism could be resurrected depending on economic circumstances.
Total foreign direct investment flows in 2000 contracted to $3.6 billion (3.6 G$), down from $9.2 billion in 1999, and $4.6 billion in 1998. The 2000 figure is about 13% of GDP. In 2000, Chile experienced an outflow of $1.5 billion, largely the result of diminished inward foreign investment and--for a second year running--elevated levels of Chilean direct investment abroad ($4.8 billion).
Foreign trade
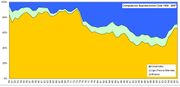
Chile's economy is highly dependent on international trade. In 2006, exports increased to $59.0 billion from $40.5 billion in 2005, and imports increased to $36.7 billion from $30.2 billion the previous year. Exports accounted for 45.1% of GDP in 2008. Chile has traditionally been dependent upon copper exports; the state-owned firm CODELCO is the world's largest copper-producing company. Foreign private investment has developed many new mines, and the private sector now produces more copper than CODELCO. Copper output continued to increase in 2000. Non-traditional exports have grown faster than those of copper and other minerals. In 1975, non-mineral exports made up just over 30% of total exports, whereas now they account for about 60%. The most important non-mineral exports are forestry and wood products, fresh fruit and processed food, fishmeal and seafood, and other manufactured products.
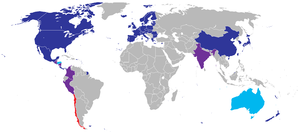
Chile's export markets are fairly balanced among Europe, Asia, South America, and North America. The U.S., the largest-single market, takes in 17% of Chile's exports. Latin America has been the fastest-growing export market in recent years. The government actively seeks to promote Chile's exports globally, and since 2004 has had the US-Chile Free Trade Agreement in place. Since 1991, Chile has signed several bilateral free trade agreements, including Canada, Mexico, South Korea, USA, the People's Republic of China, the CACM nations (Costa Rica, El Salvador, Honduras, Guatemala, Nicaragua), the EFTA and the European Union and has recently entered into the Trans-Pacific Strategic Economic Partnership which is a multilateral free trade agreement with New Zealand, Singapore and Brunei. Chile has also recently signed a free trade agreement with Japan. This means that Chile has free-trade access to over half of the world's GDP. Chile intends to negotiate further agreements with countries such as India. Also, Chile is member (in different degrees) of many international economical instances, like APEC, WTO, Mercosur. Such diversity of relations prevents the Chilean economy from being exclusively dependent of any major partner and thus provides stability.
After growing for several years, imports were down in 1998 and 1999, reflecting reduced consumer demand and deferred investment. Imports rebounded in 2000 up 19% over 1999; capital goods make up about 22% of total imports. The United States is Chile's largest-single supplier, supplying 18.5% of the country's imports in 2000, down from 21% in 1999. Chile unilaterally lowered its across-the-board import tariff--for all countries with which it does not have a trade agreement--by a one percentage point each year until it reached 6% in 2003. Higher effective tariffs are charged only on imports of wheat, wheat flour, vegetable oils, and sugar as a result of a system of import price bands.
Finance
Chile's financial sector has grown faster than other areas of the economy over the last few years; a banking law reform approved in 1997 broadened the scope of permissible foreign activity for Chilean banks. Domestically, Chileans have enjoyed the recent introduction of new financial tools such as home equity loans, currency futures and options, factoring, leasing, and debit cards.
The introduction of these new products has been accompanied by increased use of traditional instruments such as loans and credit cards. Chile's private pension system, with assets worth roughly $36 billion at the end of September 2000, has provided an important source of investment capital for the stock market. Chile has maintained one of the best credit ratings in Latin America despite the 1999 economic slump.[18][19] In recent years, many Chilean companies have sought to raise capital abroad due to the relatively lower interest rates outside of Chile. There are three main ways Chilean firms raise funds abroad: bank loans, issuance of bonds, and the selling of stock on U.S. markets through American Depository Receipts (ADRs). Nearly all of the funds raised go to finance investment. The government is rapidly paying down its foreign debt. The combined public and private foreign debt was roughly 50% of GDP at the end of 2000, low by Latin American standards.
Income distribution
The percent of total income earned by the richest 20% of the Chilean population in 2000 was 61.0% of GDP, while the percent of total income earned by the poorest 20% of the Chilean population was 3.3% of GDP. [20]
Chile's Gini Coefficient in 2003 (53.8) has slightly changed in comparison with the value in 1995 (56.4). In 2005 the 10% poorest among the Chileans received 1.2% of GNP (2000 = 1.4%), while the 10% richest received 47% of GNP (2000 = 46%).[21]
GDP composition
Main macroeconomic aggregates of GDP.
| Sector | 2003-09 (%) | 2009 (%) |
|---|---|---|
| Private consumption | 58.3 | 59.8 |
| Government consumption | 11.6 | 13.4 |
| Inventory variation | 0.4 | -2.4 |
| Gross fixed capital formation | 20.8 | 21.4 |
| (Exports) | (42.1) | (38.1) |
| (Imports) | (33.1) | (30.4) |
| Exports - Imports | 8.9 | 7.8 |
| GDP | 100.00 | 100.00 |
Note: 2007 data are provisional, 2008-09 data are preliminary. Source: Central Bank of Chile, accessed on March 28, 2010.
GDP by sector
Gross domestic product by sector of the economy.
| Sector | 2003-09 (%) | 2009 (%) |
|---|---|---|
| Agriculture and forestry | 3.1 | 2.6 |
| Fishing | 1.0 | 0.8 |
Mining
|
17.4 15.6 1.8 |
16.4 14.4 2.0 |
| Manufacturing industry | 14.8 4.6 0.6 0.9 1.4 3.8 1.4 2.1 |
12.7 4.7 0.3 0.5 1.1 2.9 1.0 2.2 |
| Electricity, gas and water | 3.3 | 5.0 |
| Construction | 7.1 | 8.0 |
| Retail, restaurants and hotels | 9.4 | 9.4 |
| Transportation | 6.3 | 5.8 |
| Communications | 2.2 | 2.3 |
| Financial services | 15.1 | 15.9 |
| Real estate | 5.2 | 5.1 |
| Personal services (health, education, etc.) | 10.9 | 11.8 |
| Public administration | 4.2 | 4.5 |
| GDP subtotal | 100.0 | 100.0 |
| GDP rest | 5.3 | 5.6 |
| GDP total millions of current Chilean pesos billions of current U.S. dollars |
100.0 — — |
100.0 91,591,252 163.670 |
Note: 2007 data are provisional, 2008-09 data are preliminary. GDP subtotal does not include VAT taxes and import duties (ID); includes imputed bank fees (IB). GDP total = GDP subtotal - IB + VAT + ID. Source: Central Bank of Chile, accessed on March 28, 2010.
Top exports
Chile's top exports in 2008.
| Export | % |
|---|---|
| Mining | 49.46 42.49 4.36 |
| Agriculture, forestry and fishing | 5.04 4.33 1.63 |
| Industrial | 27.45 9.03 3.01 1.78 2.78 4.27 4.94 2.15 |
| Other | 4.11 |
| Goods total | 86.07 |
| Transport | 8.26 5.22 2.62 |
| Travel |
2.28 |
| Other |
3.39 |
| Services total | 13.93 |
| Total exports billions of US dollars FOB |
100.00 77.210 |
Note: Provisional data provided by the Chilean Central Bank's statistics database.
See also
- Agriculture in Chile
- Economy of South America
- Economic history of Chile
- Energy in Chile
- Fishing in Chile
- Miracle of Chile
- Market fundamentalism
- Mining in Chile
- Renewable energy
- The Shock Doctrine
- Tourism in Chile
References
- ↑ 1.0 1.1 1.2 1.3 1.4 1.5 1.6 1.7 "Indicadores Macroeconómicos". Central Bank of Chile. 2010-05-31. http://www.bcentral.cl/publicaciones/estadisticas/informacion-integrada/pdf/im_primer2010.pdf. Retrieved 2010-06-01.
- ↑ http://www.bcentral.cl/prensa/notas-prensa/pdf/18082010CCNN.pdf
- ↑ "Central Bank of Chile". Si2.bcentral.cl. http://si2.bcentral.cl/Basededatoseconomicos/951_417.asp?m=CN_B03_25&f=A&i=E. Retrieved 2010-01-31.
- ↑ "National Statistics Office". http://www.ine.cl/canales/chile_estadistico/estadisticas_precios/ipc/070110/xls/13_ipc_empalme.xls. Retrieved 2010-01-31.
- ↑ Resultados Casén 2009, Ministry of Social Planning and Cooperation.
- ↑ "2006 Casen Poll, Ministry of Planning" (PDF). http://intranet.injuv.gob.cl/cedoc/Economia/CASEN_2006.pdf. Retrieved 2010-01-31.
- ↑ 7.0 7.1 "National Statistics Office". http://www.ine.cl/canales/chile_estadistico/mercado_del_trabajo/empleo/280110/xls/serie_mensual_web_2007_a_la_fecha_18_01_2010.xls. Retrieved 2010-01-31.
- ↑ "National Statistics Office". http://www.ine.cl/canales/chile_estadistico/mercado_del_trabajo/empleo/series_estadisticas/series_2002/rama_xls/r98/ramTotalNacional.xls. Retrieved 2010-01-31.
- ↑ "Doing Business in Chile 2010". World Bank. http://www.doingbusiness.org/ExploreEconomies/?economyid=41. Retrieved 2010-08-20.
- ↑ http://www.weforum.org/pdf/GCR09/GCR20092010fullrankings.pdf
- ↑ "Rankings - Doing Business - The World Bank Group". Doing Business. http://www.doingbusiness.org/economyrankings/. Retrieved 2010-01-31.
- ↑ "Economic Department - Embassy of Chile in the United States of America". Chileusafta.com. http://www.chileusafta.com/noticia%2047.htm. Retrieved 2010-01-31.
- ↑ https://www.cia.gov/library/publications/the-world-factbook/rankorder/2129rank.html
- ↑ The World Distribution of Household Wealth A map of world poverty
- ↑ BBC - Inequality remains in Chile
- ↑ CIA - The World Factbook
- ↑ Choice of Product under Government Regulation: The Case of Chile Pension System
- ↑ "Latin America". Bloomberg.com. 2006-01-31. http://www.bloomberg.com/apps/news?pid=10000086&sid=aJpAMCwBazSQ&refer=latin_america. Retrieved 2010-01-31.
- ↑ "Harvard University professor will be Chile’s finance minister « The Chilean Observador". Periodistainternet.wordpress.com. 2006-02-01. http://periodistainternet.wordpress.com/2006/02/01/harvard-university-professor-will-be-chiles-finance-minister/. Retrieved 2010-01-31.
- ↑ "eco_cou_152.xls" (PDF). http://earthtrends.wri.org/pdf_library/country_profiles/eco_cou_152.pdf. Retrieved 2010-01-31.
- ↑ "Document of Strategy Chile" (PDF). http://ec.europa.eu/external_relations/chile/csp/07_13_en.pdf. Retrieved 2010-01-31.
Bibliography
- COLLIER, Simon and Sater, William F. A History of Chile, 1808-2002, New York and London, Cambridge University Press, 2004.
- CONSTABLE, Pamela and Valenzuela, Arturo. A Nation of Enemies: Chile Under Pinochet. New York, W. W. Norton & Company, 1993.
- PALEY, Julia. Marketing Democracy: Power and Social Movements in Post-Dictatorship Chile. University of California Press, 2001
- SCHAEFER, Standard. Chile's Failed Economic Laboratory: an Interview with Michael Hudson. CounterPunch, October 20, 2003
- WINN, Peter (editor).Victims of the Chilean Miracle: Workers and Neoliberalism in the Pinochet Era, 1973-2002. Durham, NC: Duke University Press, 2004.
External links
- The Economic Transformation of Chile: A Model of Progress - HACER
- Invest in Chile
- World Reviews on Chile - this is Chile
|
|||||||||||